Protocol - Race/Ethnic Residential Segregation - American Community Survey
Description
The protocol is based on extracting data from the U.S. Census Bureau on a set of variables related to the concept of residential segregation. Residential segregation describes the distribution of different race/ethnic groups across smaller areal units (e.g., census tracts) within larger areas (e.g., counties or metropolitan statistical areas [MSAs]). The Dissimilarity Index is one of the most commonly used race/ethnic residential segregation measures. All the relevant variables are available from the decennial censuses or the American Community Survey (ACS) 5-year estimates. Once the data are extracted, the Dissimilarity Index can be calculated.
Which data set should be used?
Users interested in using measures of residential segregation in conjunction with the Neighborhood Concentrated Disadvantage protocol should use data from the ACS 5-year estimates for consistency of data sources. Users who are interested in using the 100% count data rather than estimates or making comparisons of residential segregation in metropolitan areas across time (e.g., 1990 vs. 2010) should use data from the Decennial Censuses. The protocol here describes the process using 5-year estimates from the ACS. Users interested in using the Decennial Census data should refer to the alternate protocol.Specific Instructions
Assuming that information on current address (see PhenX Demographics domain, Current Address measure) has been collected for a study respondent, then it is possible to use geocoding to link the address of a study participant to his or her local neighborhood (or other large geographical unit).
It is necessary to extract data for smaller units (e.g., census tracts) to calculate the Dissimilarity Index for each larger unit. To aid comparability between studies, the Social Environment Working Group recommends that researchers set the smaller area to the census tract and the larger area to the metropolitan statistical area.
Additionally, researchers can use the census variables to calculate more basic diversity scores at the census-tract level such as the entropy index.
The most common conceptualization of residential segregation is based on the dimension of evenness (Taeuber & Taeuber, 1965; White, 1986; Massey & Denton, 1988; Reardon & O’Sullivan, 2004), and the most widely used measure of residential segregation is the Dissimilarity Index, sometimes referred to as D. This measure is computationally straightforward to calculate from Census data, and while the index of dissimilarity was originally applied in a comparison of two different population groups (most often whites and blacks), recent papers have extended this measure to the multiple race/ethnic group case (Reardon & Firebaugh, 2002), and others have extended the two populations and multigroup measure by incorporating the spatial dimension using data from adjacent or proximate census units and weighting accordingly (White, 1983; Wong, 1993; Reardon & O’Sullivan, 2004; Reardon et al., 2008).
Availability
This protocol is freely available; permission not required for use.
Protocol
The Dissimilarity Index is based on U.S. Census Bureau data. This protocol describes how to make calculations using 5-year American Community Survey (ACS) estimates.
The ACS data used in this protocol can be accessed by using Excel to read the Summary Files or using the “Download Center” at the U.S. Census Bureau’s American FactFinder portal at http://factfinder.census.gov. Users can find additional information on these tools at the following locations:
Using Excel to Access Summary Files: http://www2.census.gov/programs-surveys/acs/summary_file/2014/documentation/tech_docs/ACS_SF_Excel_Import_Tool.pdf
Using the Download Center: http://www2.census.gov/programs-surveys/acs/summary_file/2014/documentation/tech_docs/How_to_Access_ACS_Estimates_AFF.pdf
The technical documentation for the ACS summary files is available online at http://www.census.gov/programs-surveys/acs/technical-documentation.html. Select the “Summary File Documentation” link, and then select the data set of interest. Users not familiar with Census data should consult the technical materials.
The key race/ethnicity data in the ACS are found in "Table B03002: Hispanic or Latino by Race." This table is preferred over other possible race and race/ethnic tables available, as it provides data on the main race/ethnic groups in the United States and explicitly incorporates data on Hispanic or Latino populations, otherwise not available in the race-only tables.
| Variable Code | Variable Name |
| B03002001 | Total: |
| B03002002 | Not Hispanic or Latino: |
| B03002003 | White alone |
| B03002004 | Black or African American alone |
| B03002005 | American Indian and Alaska Native alone |
| B03002006 | Asian alone |
| B03002007 | Native Hawaiian and Other Pacific Islander alone |
| B03002008 | Some other race alone |
| B03002009 | Two or more races: |
| B03002010 | Two races including Some other race |
| B03002011 | Two races excluding Some other race, and three or more races |
| B03002012 | Hispanic or Latino: |
| B03002013 | White alone |
| B03002014 | Black or African American alone |
| B03002015 | American Indian and Alaska Native alone |
| B03002016 | Asian alone |
| B03002017 | Native Hawaiian and Other Pacific Islander alone |
| B03002018 | Some other race alone |
| B03002019 | Two or more races: |
| B03002020 | Two races including Some other race |
| B03002021 | Two races excluding Some other race, and three or more races |
The race/ethnic data are available for all small census geographies-such as census block, census block group, and census tract-and can be easily extracted for almost any geographic level. Note: Although block group data have long been available from the Census File Transfer Protocol site, the Census Bureau did not make block groups available for download at American FactFinder until the release of the 2009-2013 ACS. Information about accessing block group data for earlier years is available at http://www.census.gov/library/video/acs_block_group.html.
Researchers can use the data in this table to easily calculate basic variables (e.g., the percentage of any race and/or ethnicity group) or to combine groups (e.g., all minorities).
The Dissimilarity Index provides data on larger areas (e.g., metropolitan statistical areas) using smaller-level data.
The most common conceptualization of residential segregation is based on the dimension of evenness. Evenness refers to the differential distribution of the subject population across neighborhoods in a large area (e.g., metropolitan area). It ranges from 0 (complete integration) to 1 (complete segregation) and indicates the percentage of a group’s population that would have to change residence for each neighborhood to have the same percentage of that group as the metropolitan area overall. It is computed as:
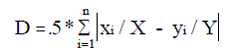
where
n is the number of tracts in the larger area (e.g., a metropolitan area),
xi is the population size of the minority group of interest in tract i,
X is the population of the minority group in the larger area (e.g., metropolitan area) as a whole,
yi is the population of the reference group (usually non-Hispanic whites) in tract i, and
Y is the population of the reference group in the larger area (e.g., metropolitan) area as a whole.
The calculation requires the computation of the totals for each group across all subareas within a larger region (e.g., all census tracts within a county), the proportion of each group within each subarea, the absolute difference between the proportions, and the sum of the absolute differences. The latter number is multiplied by 0.5 to generate a result between 0.0 and 1.0. A value of 0.0 would indicate there were the same proportions of majority and minority group populations in each subarea, as in the larger regions’ population. If all subareas within the region contain members of just one group (i.e., there is no co-residence), then D equals 1.0, indicating complete segregation.
Extending the Dissimilarity Index: The Multigroup Analog
While much early research on segregation looked at two groups (e.g., black and white, or majority and minority), today’s society is multiethnic. Two-group measures are useful but limited for describing complex patterns of segregation. The choice to use a two-group or multigroup D depends on the specific question of interest. In a region where the population is composed of three groups (e.g., white non-Hispanic, black non-Hispanic, and Hispanic), we may be interested in
a) segregation between two specific groups (e.g., How segregated are white from black residents?); or
b) segregation among all three groups (e.g., How segregated are white non-Hispanic, black non-Hispanic, and Hispanic residents from each other?).
The two-group measure can still be used by comparing all possible pairs of population groups (Morrill, 1995), but these are not comprehensive, and multiple groups are not treated simultaneously. To address segregation among multiple groups requires a multigroup analog to D (Morgan et al., 1975; Sakoda, 1981). The multigroup analog describes the extent to which two or more population groups are similarly distributed among subareas. The formula for multigroup dissimilarity (from Reardon & Firebaugh, 2002) is:
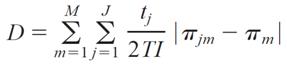
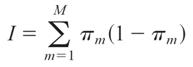
where
T is total population,
M is the number of groups m,
J is the number of subareas or units j,
tj is number of individuals in subarea j,
πm is the proportion in group m,
πjm is the proportion in group m, of those in unit j, and
I is the Simpson’s Interaction Index, given by
The interpretation of multigroup D (sometimes labeled as D(m)) is the same as D (Wong, 1993).
In the Stata statistical software package, the command seg (installed by typing "ssc install seg" from within Stata) will compute D (Reardon, 2002).
Researchers have extended segregation measures by incorporating the spatial dimension (White, 1983; Wong, 1993; Reardon & O’Sullivan, 2004). There are spatially modified versions of the D index (Wong, 1993).
Personnel and Training Required
Knowledge of Census data products and websites, such as American Factfinder and/or publicly available data portals (e.g., https://nhgis.org/), and/or commercial geospatial data products, such as that provided by vendors like GeoLyticsor Social Explorer
The extracted data need to be manipulated, and the Index of Dissimilarity needs to be calculated.
Equipment Needs
Access to a desktop/laptop computer with Internet access to download raw data from the U.S. Census Bureau’s American Factfinder website. Statistical Packages (e.g., SPSS, SAS) for data manipulation.
Requirements
| Requirement Category | Required |
|---|---|
| Major equipment | No |
| Specialized training | No |
| Specialized requirements for biospecimen collection | No |
| Average time of greater than 15 minutes in an unaffected individual | No |
Mode of Administration
Secondary Data Analysis
Lifestage
Infant, Toddler, Child, Adolescent, Adult, Senior, Pregnancy
Participants
Not applicable; derived from publicly available secondary data.
Selection Rationale
The PhenX Social Environments Working Group preferred an objective measure of racial/ethnic residential segregation using U.S. Census Bureau data. A questionnaire that relies on subjective judgment based on retrospective ascertainment is likely to be unreliable.
Language
English
Standards
| Standard | Name | ID | Source |
|---|---|---|---|
| Logical Observation Identifiers Names and Codes (LOINC) | Race - ethnic resid segregation proto | 63038-4 | LOINC |
| caDSR Form | PhenX PX211403 - Race Ethnic Residential Segregation American Community | 6912549 | caDSR Form |
Derived Variables
None
Process and Review
The Expert Review Panel #2 (ERP 2) reviewed the measures in the Demographics, Social Environments, and Environmental Exposures domains.
Guidance from ERP 2 includes:
• Added a new protocol
• New Data Dictionary
Back-compatible: there are changes to the Data Dictionary, previous version of the Data Dictionary and Variable mapping in Toolkit archive (link)
Protocol Name from Source
American Community Survey (ACS), 5-year estimates
Source
Recommended data sources include the following:
U.S. Census Bureau American Community Survey (ACS) data products (5-year estimates). http://www.census.gov/programs-surveys/acs
American Factfinder website. http://factfinder.census.gov
Note that several online sources provide Dissimilarity Index scores for selected metropolitan statistical areas, counties, and school districts (and across Census years). See, for example, the American Communities Project and the School Segregation Project at the Brown and Lewis Mumford Center at Albany (http://www.s4.brown.edu/cen2000/index.html: http://www.s4.brown.edu/schoolsegregation/index.htm) as well as the Spatial Impact Factor Web Data at RTI International (http://rtispatialdata.rti.org/).
General References
Iceland, J., & Douzet, F. (2006). Measuring racial and ethnic segregation. Hrodote, 122(3): 25-43.
Iceland, J., Weinberg, D. H., & Steinmetz, E. (2002). Racial and ethnic residential segregation in the United States: 1980-2000 (U.S. Census Bureau, Series CENSR‑3). Washington DC: U.S. Government Printing Office.
Massey, D. S., & Denton, N. A. (1988). The dimensions of residential segregation. Social Forces, 67, 281-315.
Morgan, P. M., Murphy, R. F., Willis, R. A., Hubbard, D. W., & Norton, J. M. (1975). Dental health of Louisiana residents based on the ten-state nutrition survey. Public Health Reports, 90(2), 173-178.
Morrill, R. L. (1995). Aging in place, age specific migration and natural decrease. Annals of Regional Science, 29(1), 41-66.
Reardon, S. F. (2006). A conceptual framework for measuring segregation and its associations with population outcomes. In J. M. Oakes & J. S. Kaufman (Eds.), Methods in social epidemiology (pp. 169-192). San Francisco, CA: Wiley and Sons/Jossey-Bass.
Reardon, S. F., & Firebaugh, G. (2002). Measures of multi-group segregation. Sociological Methodology, 32, 33-67.
Reardon, S. F., Matthews, S. A., O’Sullivan, D., Lee, B. A., Firebaugh, G., Farrell, C. R., & Bischoff, K. (2008). The geographic scale of metropolitan racial segregation. Demography, 45(3), 489-514.
Reardon, S. F., & O’Sullivan, D. (2004). Measures of spatial segregation. Sociological Methodology, 34, 121-162.
Sakoda, J. M. (1981). A generalized index of dissimilarity. Demography, 18(2), 245-250.
Taeuber, K. E., & Taeuber, A. F. (1965). Negroes in cities: Residential segregation and neighborhood change. Chicago, IL: Aldine.
Theil, H. (1972). Statistical decomposition analysis (Vol. 14). Amsterdam, Netherlands: North-Holland.
White, M. J. (1983). The measurement of spatial segregation. American Journal of Sociology, 88, 1008-1018.
White, M. J. (1986). Segregation and diversity measures in population distribution. Population Index, 52, 198-221.
Wong, D. S. (1993). Spatial indices of segregation. Urban Studies, 30, 559-572.
Protocol ID
211403
Variables
Export Variables| Variable Name | Variable ID | Variable Description | dbGaP Mapping | |
|---|---|---|---|---|
| PX211403_RaceEthnicSegregation_ACS_Hispanic | ||||
| PX211403120000 | Hispanic or Latino | Variable Mapping | ||
| PX211403_RaceEthnicSegregation_ACS_Hispanic_AsianAlone | ||||
| PX211403160000 | Hispanic or Latino - Asian alone | N/A | ||
| PX211403_RaceEthnicSegregation_ACS_Hispanic_BlackAlone | ||||
| PX211403140000 | Hispanic or Latino - Black or African more | N/A | ||
| PX211403_RaceEthnicSegregation_ACS_Hispanic_Hawaiian_PacificIslanderAlone | ||||
| PX211403170000 | Hispanic or Latino - Native Hawaiian and more | N/A | ||
| PX211403_RaceEthnicSegregation_ACS_Hispanic_Native_AmericanAlone | ||||
| PX211403150000 | Hispanic or Latino - American Indian and more | N/A | ||
| PX211403_RaceEthnicSegregation_ACS_Hispanic_Other_RaceAlone | ||||
| PX211403180000 | Hispanic or Latino - Some other race alone | N/A | ||
| PX211403_RaceEthnicSegregation_ACS_Hispanic_TwoAndOther_Race | ||||
| PX211403200000 | Hispanic or Latino - Two races including more | N/A | ||
| PX211403_RaceEthnicSegregation_ACS_Hispanic_TwoNotSomeOther_Races | ||||
| PX211403210000 | Hispanic more | N/A | ||
| PX211403_RaceEthnicSegregation_ACS_Hispanic_TwoOrMore_RacesAlone | ||||
| PX211403190000 | Hispanic or Latino - Two or more races alone | N/A | ||
| PX211403_RaceEthnicSegregation_ACS_Hispanic_WhiteAlone | ||||
| PX211403130000 | Hispanic or Latino - White alone | N/A | ||
| PX211403_RaceEthnicSegregation_ACS_NotHispanic | ||||
| PX211403020000 | Not Hispanic or Latino | Variable Mapping | ||
| PX211403_RaceEthnicSegregation_ACS_NotHispanic_AsianAlone | ||||
| PX211403060000 | Not Hispanic or Latino - Asian alone | N/A | ||
| PX211403_RaceEthnicSegregation_ACS_NotHispanic_BlackAlone | ||||
| PX211403040000 | Not Hispanic or Latino - Black or African more | N/A | ||
| PX211403_RaceEthnicSegregation_ACS_NotHispanic_Hawaiian_PacificIslanderAlone | ||||
| PX211403070000 | Not Hispanic or Latino - Native Hawaiian and more | N/A | ||
| PX211403_RaceEthnicSegregation_ACS_NotHispanic_Native_AmericanAlone | ||||
| PX211403050000 | Not Hispanic or Latino - American Indian and more | N/A | ||
| PX211403_RaceEthnicSegregation_ACS_NotHispanic_Other_RaceAlone | ||||
| PX211403080000 | Not Hispanic or Latino - Some other race alone | N/A | ||
| PX211403_RaceEthnicSegregation_ACS_NotHispanic_TwoAndOther_Race | ||||
| PX211403100000 | Not Hispanic or Latino - Two races including more | N/A | ||
| PX211403_RaceEthnicSegregation_ACS_NotHispanic_TwoNotSomeOther_Races | ||||
| PX211403110000 | Not Hispanic or Latino - Two races excluding more | N/A | ||
| PX211403_RaceEthnicSegregation_ACS_NotHispanic_TwoOrMore_RacesAlone | ||||
| PX211403090000 | Not Hispanic or Latino - Two or more races alone | N/A | ||
| PX211403_RaceEthnicSegregation_ACS_NotHispanic_WhiteAlone | ||||
| PX211403030000 | Not Hispanic or Latino - White alone | N/A | ||
| PX211403_RaceEthnicSegregation_ACS_Total_Population | ||||
| PX211403010000 | Total Population | N/A | ||
Measure Name
Race/Ethnic Residential Segregation
Release Date
October 8, 2010
Definition
Race/Ethnic Residential Segregation is a measure of neighborhood race/ethnic residential segregation, based on data from the U.S. Census Bureau.
Purpose
This measure examines various population characteristics to determine the degree of race/ethnic residential segregation, the degree to which various groups reside in different neighborhoods (Iceland & Douzet, 2006). Race/ethnic residential segregation, particularly when resulting from discrimination, can have negative consequences for minority group members. Race/ethnic residential segregation can limit residential choice, constrain economic and educational opportunities by limiting people’s access to good schools and jobs, serve to concentrate poverty in disadvantaged neighborhoods, and contribute to social exclusion and alienation (Massey & Denton, 1988). Residential segregation also affects the nature and quality of intergroup relations in society: segregation reduces contact between groups and is usually thought to cause and reflect polarization across communities (Reardon, 2006). Following Reardon (2006), a region is segregated to the extent to which individuals of a different group live in different neighborhoods in a region. That is, the term segregation does not apply to individual neighborhoods but to larger regions (e.g., school districts, counties, metropolitan statistical areas).
Keywords
ACS, American Community Survey, neighborhood, Neighborhood Disadvantage, Residential Segregation, Social Determinants of Health, U.S. Census, environmental health disparities, neighborhood built environment
Measure Protocols
| Protocol ID | Protocol Name |
|---|---|
| 211402 | Race/Ethnic Residential Segregation - U.S. Census |
| 211403 | Race/Ethnic Residential Segregation - American Community Survey |
| 211404 | Race/Ethnic Residential Segregation - Separation (S) Index, Unbiased |